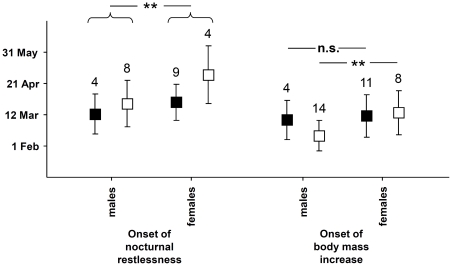
Figure 1. Mean (±s.d.) dates of onset of nocturnal restlessness and of body mass increase in male and female northern wheatears in spring.
Black squares: Icelandic population, white squares: Norwegian population. The numbers above each boxplot indicate the sample sizes. Stars indicate P-level: **P<0.01. For better understanding, we assigned Day 1 of our count (starting on the day of photoperiodic switch) to a standardized date which was defined as the mean date of photoperiodic switch in the two years of experiment. For our data, this date was 26 August.

