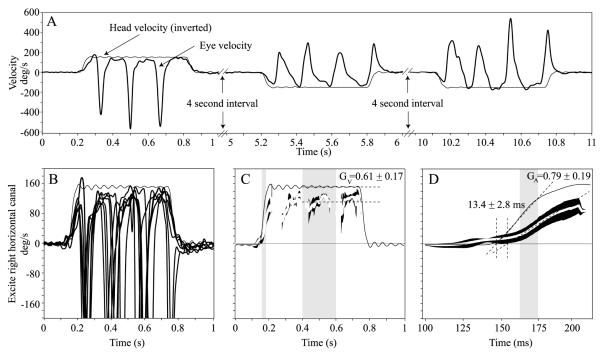
Figure 2.
(A) Raw traces of horizontal eye velocity (thick black trace) during leftward and rightward yaw head rotation impulses (accelerations at 3000°/s2 reaching a peak velocity of 150°/s). The head stimuli (thin black trace) were delivered semi-randomly. The head velocity trace was inverted for comparison to eye velocity. (B) Horizontal component of 3D eye and head rotational velocity during multiple rightward yaw head rotation impulses in one mouse. The slow phase eye velocity response is almost perfectly compensatory (opposite in direction to head velocity) during the first ~60 ms after head rotation onset. Once the eye reaches the end of its oculomotor range, a quick phase, which is opposite in direction to the slow phase, brings the eye back to the centre of the oculomotor range. This cycle repeats for the duration of the transient. (C) Quick phases have been removed from the leftmost panel data leaving only the slow phases for analysis. Mean slow phase eye and head velocity traces (Mean ± 1SE) are shown. The velocity gain, GV, is calculated by dividing the mean slow phase eye velocity by the mean head velocity during 200 ms of the velocity plateau shown in grey. (D) The first 200ms of the middle panel data are used to calculate the acceleration gain, GA, which is the ratio of the eye to head velocity trace slopes during the linear part of the acceleration portion of the transient (gray region). Intersections of the line fits used to calculate GA with the zero velocity axis are used to calculate latency.

