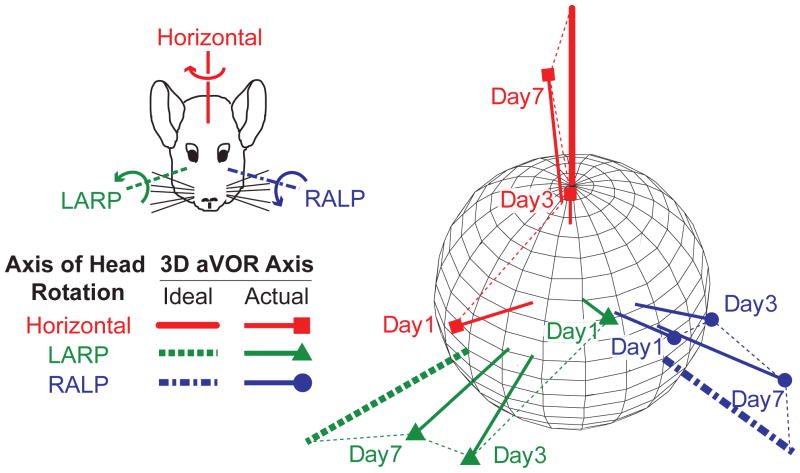
Fig 2.
Changes in axis of eye response for one chinchilla over 7 days of stimulation. Each data vector depicts the 3D axis and magnitude of aVOR responses during whole-body 2 Hz, 50°/s peak head rotations in darkness about the mean horizontal, LARP, and RALP semicircular canal axes. Vector length indicates the peak response velocity; for comparison, thick axes depict inverse of 50°/s peak head rotations about each canal axis. Data shown are for peak excitatory responses; curved arrows in inset show direction of aVOR response to excitation of the corresponding semicircular canal in the left labyrinth. Progression over time toward the ideal response is apparent for each axis of head rotation.

