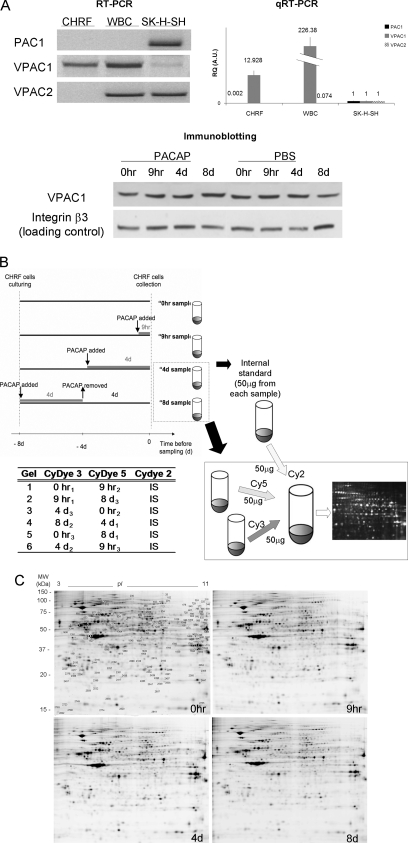
Fig. 1.
Expression of PACAP receptors in different human cell types/lines, schematic workflow of sample preparation for 2D-DIGE and representative gels for each time point of the PACAP treatment of CHRF cells. A, Total RNA from human CHRF cell line (lane 1), white blood cells (lane 2), and SK-N-SK neuroblastoma cell line (lane 3) was submitted to RT-PCR (left panel) and qRT-PCR (right panel) with primers designated to amplify PAC1, VPAC1 or VPAC2. Data reported for qRT-PCR are the average of the expression level of at least two replicates ± the standard deviation; all the RQ (Relative Quantification) expression values are normalized for the values of SK-H-SH cell line. Both experiment findings are consistent and show that CHRF cells uniquely express VPAC1 receptor. The lower panel shows the expression of VPAC1 at protein level in CHRF cells during a time course where cells were treated with PACAP38 or vehicle PBS (integrin β3 was used as loading control). The image is representative of three independent experiments. B, CHRF cells were treated with 100 mm PACAP38. Controls received fresh medium without PACAP at t = 0 h (no PACAP). PACAP was added for 9 h (early PACAP response) or 4 days (late PACAP response) and on day 4 removed and replaced with fresh medium for other 4 days (t = 8 day, PACAP washout). All CHRF cell samples were grown for the same period of time (8 days). Experiments were repeated three times to adjust for interexperimental variations. Untreated and treated cell pellets were lysed, labeled, mixed, and run in one gel with an equal amount of internal standard (IS). This standard was pooled from all 12 samples in the experiment. The lower part of the figure exemplarily depicts the procedure for time points t = 4 day and t = 8 day. The table reports the experimental design for DIGE: the samples following PACAP treatment (0 h, 9 h, 4 day, and 8 day) were analyzed in triplicate by running six gels, in order to maximize the likelihood of detecting any sample-to-sample variation. C, 2D DIGE representative image of CHRF cell lysates proteins: 0 h (control), 9 h and 4 day after PACAP treatment and 8 day (4 day after PACAP removal). Proteins were separated in 24 cm, NL pH 3–10 IPG strips for the first dimension and 12.5% polyacrylamide gel for the second dimension. The image was acquired on a Typhoon 9400 scanner. Protein spots that change in expression during the time course (p < 0.05 by the application of FDR correction methods) are indicated (protein identifications are listed in Table I).

