Fig. 2.
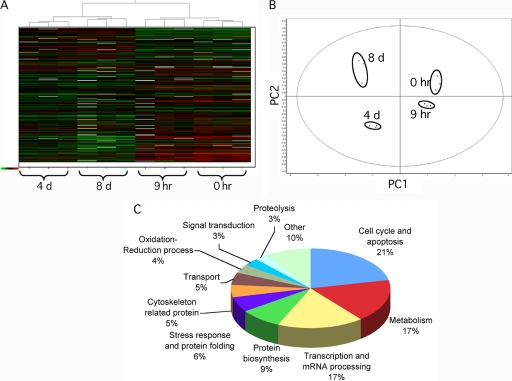
Multivariate analysis of DIGE results. A, Hierarchical clustering of the CHRF cell lysates based on the global expression patterns of modulated proteins detailed in supplemental Table S1. In the heat map, each vertical column represents one proteomic map of the 12 samples, whereas each horizontal row represents one protein, with relative expression values displayed as an expression matrix (heat map) using a relative scale ranging from –0.5 (green) to +0.5 (red). The green and red color mean that the expression decreased or increased compared with the standard, respectively: the brighter the color, the stronger the change. B, Each dot in the scatter plots represents a proteomic map, which describes the global expression values for the subset of proteins listed in supplemental Table S1. The PCA and hierarchical clustering analysis were consistent between them and indicated a complete and clear separation of the 12 individual Cy3- and Cy5-labeled DIGE expression maps into the four points of the time course following PACAP treatment. PC1: principal component analysis 1; PC2: principal component analysis 2. C, Functional classification of PACAP modulated proteins in CHRF cells identified by DIGE and MS. Proteins were classified using the information provided by the Gene Ontology project (http://amigo.geneontology.org/cgi-bin/amigo/go.cgi).

