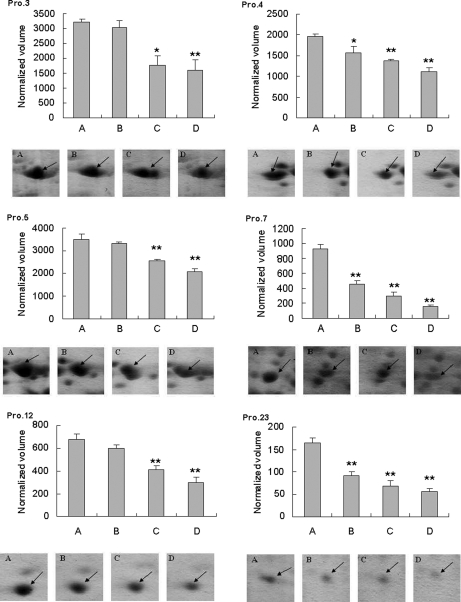
Fig. 2.
Changes in abundance of hepatic protein spots in fish among test groups. Protein identification is shown in Tables I and II. A, control group; B, VRP treatment group at 0.5 μg/liter; C, VRP treatment group at 27.0 μg/liter; D, VRP treatment group at 270 μg/liter. *, significant difference was p < 0.01 with one-way ANOVA; **, significant differences was p < 0.001 with one-way ANOVA.

