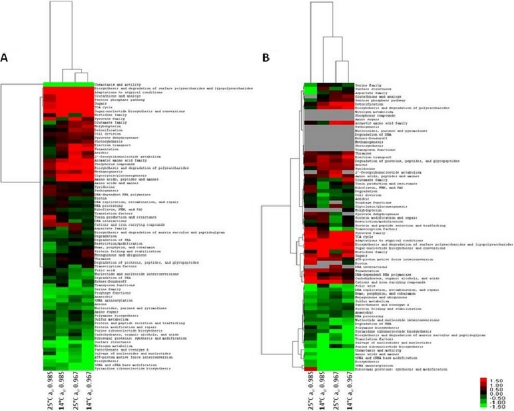
Fig. 1.
Hierarchical clustering analysis of transcriptomic (A) and proteomic data (B), based on the T-profiler results. The heat map is linked by a dendrogram representing clustering of different experimental conditions (top), and T-values for JCVI CMR functional categories (side). The color code is as follows: red indicates positive T-values; green indicates negative T-values; and gray indicates not determined.

