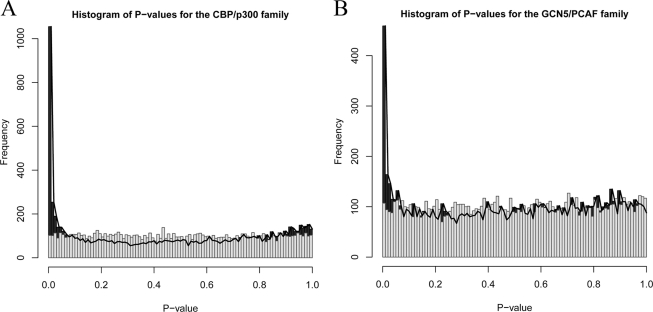
Fig. 4.
Histogram of p values in the CBP/p300 and GCN5/PCAF families. A, Histogram of p values for the CBP/p300 family. The black bars and black lines are for p values for 10,000 sites that are randomly extracted from all sites with the pre-defined 267 peptides for CBP/p300. The gray bars are for p values of 10,000 sites that are randomly extracted from all sites with random predefined peptides (267 in size). B, Histogram of p values for the GCN5/PCAF family.

