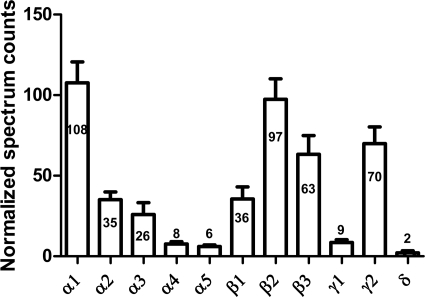
Fig. 10.
Relative abundance of GABAA receptor subunits determined by label-free quantitative analysis. The mean ± S.E. of the normalized spectrum counts for three replicate samples are shown on the graph, with the mean value labeled for each subunit. The stoichiometry of α: β: (γ+δ) = 2.3: 2.4: 1, consistent with the expected 2: 2: 1 stoichiometry.

