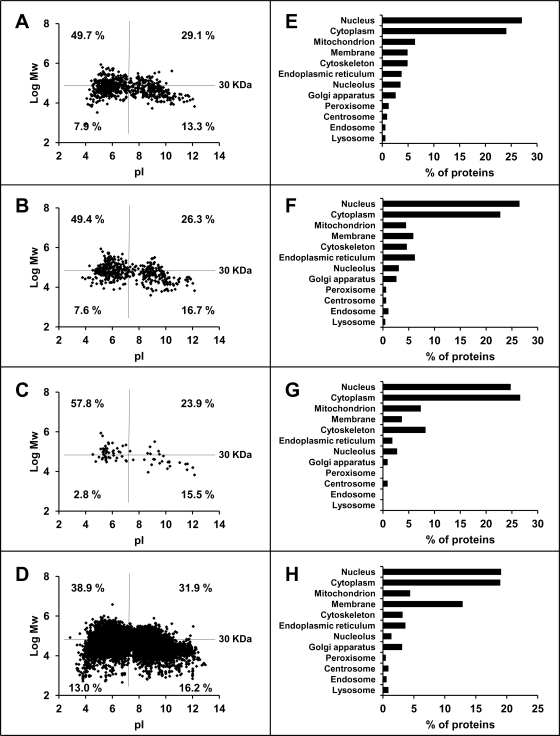
Fig. 3.
Parental proteins of A*68:01 ligands and their relationship to those of HLA-B27 and to the human proteome. A–D, the molecular mass (log Mw) was plotted versus the isoelectric point (pI) for (A) the parental proteins (n = 672) of A*68:01 ligands, (B) those of B*27:05 ligands (n = 471) (42), (C) parental proteins (n = 74) common to A*68:01 and B*27:05 ligands, and (D) the human proteome (UniProtKB database release 14.0: 2008/07/22). In each panel, the proteins are classified by size (using a 30KD threshold) and pI, and the percentage of each subset is specified. E–H, subcellular distribution of (E) the parental proteins of A*68:01 ligands, (F) those of B*27:05 ligands, (G) parental proteins common to A*68:01 and B*27:05 ligands, and (H) the human proteome. The analysis was carried out using the Protein Information and Knowledge Extractor software (39) at http://proteo.cnb.csic.es/pike/analysis.html.

