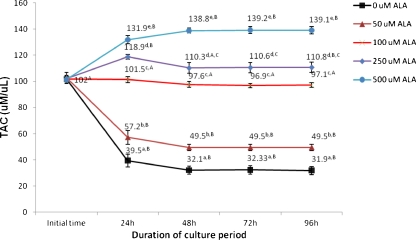
Fig. 3.
TAC levels in cultured preantral follicles in the presence of different concentration of ALA. In all cases 4 experimental replicates were performed. Groups with different superscripts (a, b, c, d, e) are significantly different (p < 0.05) at same times of culture within the different groups. Different superscripts (A, B, C, D) describe significantly different (p < 0.05) at different times of culture within the same group. TAC: Total Antioxidant capacity; ALA: Alpha lipoic acid

