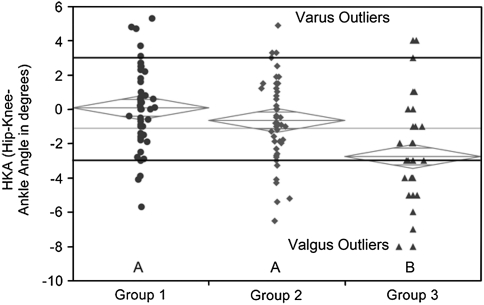
Fig. 7.
The graph shows one-way analysis of the hip-knee-ankle (HKA) angle by group, depicting the variation in coronal alignment between the three groups and the number of varus and valgus outliers outside the accepted range of 3° to −3°. The diamonds indicate the 95% confidence interval for each group.

