
Fig. 1.
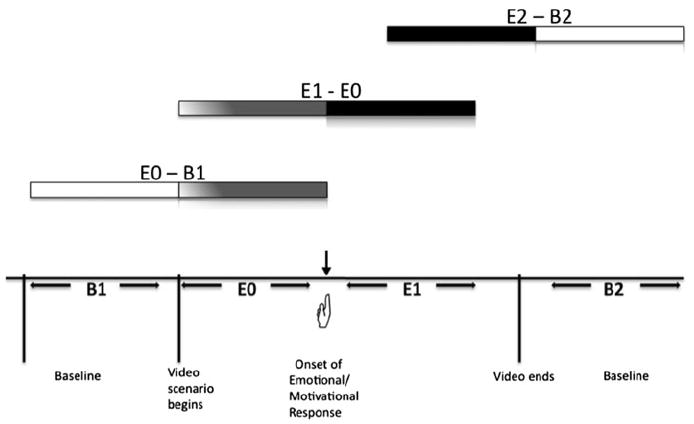
Schematic representation of time epoch comparisons for the study. B1 represents the first baseline; upon viewing of a the video, a button press by the individual indicates the onset of an emotional or motivational response (
 ); E0 represents the epoch prior to the button press; E1 represents the epoch immediately following the button press; E2 represents the final period of the video viewing. Horizontal bar lines represent comparisons between different epochs