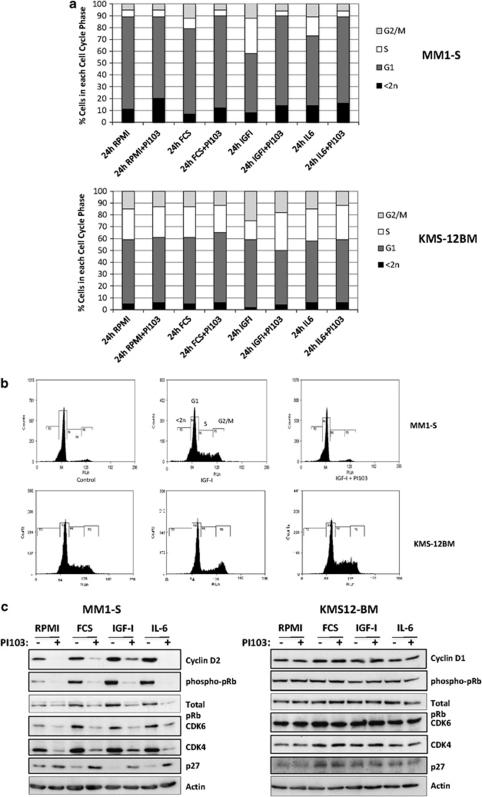
Figure 2.
Effect of PI-103 on cell cycle status in MM1S and KMS12-BM. Cells were cultured for 24 h in either serum-free medium (RPMI-1640) or RPMI-1640 plus 10% FCS, 100 ng/ml IL-6 or 100 ng/ml IGF-I±1 μ PI-103 and analysed for DNA content by propidium iodide staining and flow cytometry. (a) The percentage of cells in each cell cycle phase with the different culture conditions is indicated by the shading within the bars, according to the key. Data shown are from one of three representative experiments. (b) Representative cell cycle plots indicating DNA content are shown for MM1S (upper panels) and KMS12-BM (lower panels). (c) Western blots for MM1S and KMS12-BM, cultured for 24 h as above, were probed with antibodies against cell cycle control proteins, as indicated. Anti-actin is shown as a loading control.

