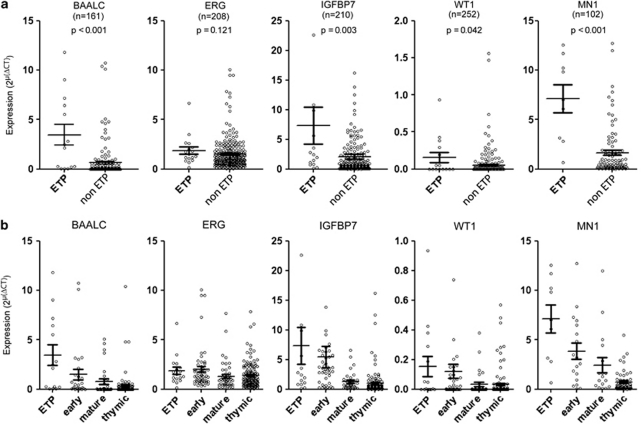
Figure 2.
Expression of genes known to be correlated with outcome in T-ALL and AML. Analysis of samples with sufficient RNA was carried out by RT-PCR. For each entity the median expression is shown by a horizontal bar with the s.e. of the mean. (a) Comparison between ETP-ALL and the remaining non-ETP T-ALL. (b) Expression in the different immunophenotype-defined subgroups of T-ALL. Early T-ALL refers to non-ETP early T-ALL.

