Figure 1.
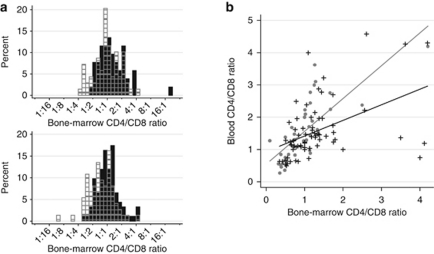
Bone marrow CD4/CD8 ratios and their correlations to blood CD4/CD8 ratios stratified by bone marrow lymphoma involvement. (a) Shows histograms of the bone marrow CD4/CD8 ratios in the first (above) and second (below) data sets. Black bars show the distribution of CD4/CD8 ratios in bone marrows involved with lymphoma and gray-striped transparent bars CD4/CD8 ratios in those uninvolved with lymphoma. (b) Shows the correlations between bone marrow and blood CD4/CD8 ratios. In patients without bone marrow lymphoma involvement (gray dots and gray fitted line), there was a general, systemic congruence between the two types of tissue. In patients with bone marrow involvement (black crosses and black fitted line), there was markedly less congruence.

