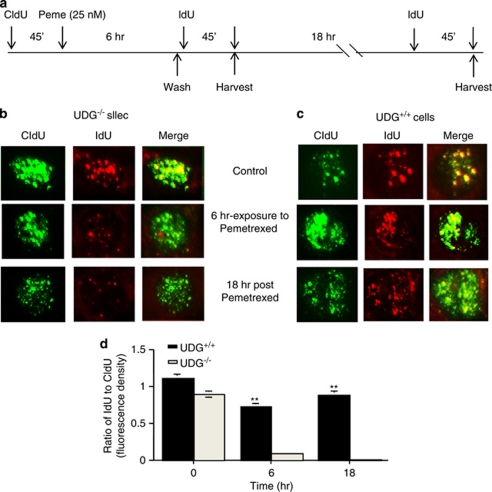
Figure 5.
Inhibition of DNA replication induced by pemetrexed. (a) Schematic diagram of the CldU, pemetrexed and IdU pulse treatments. (b) UDG−/− and (c) UDG+/+ cells were fixed at 6 and 24 h after treatments and subjected to fluorescent immunostaining. Replication foci were labeled with CldU (green) and IdU (red). Results are representative of two independent experiments. (d) The ratio of IdU to CldU was measured as the ratio of the mean fluorescent density of IdU versus CIdU for each cell (n=40)

