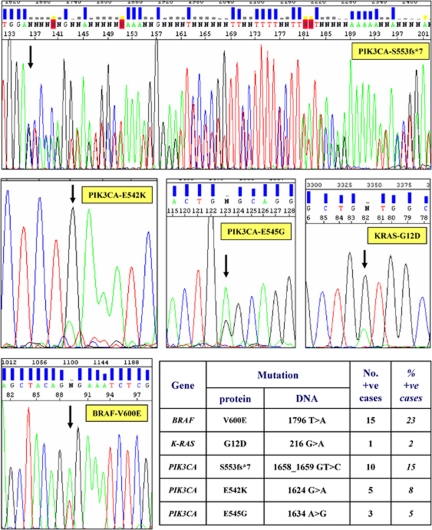
Figure 1.
Sequencing results for identified somatic mutations. Electropherograms show the nucleotide sequences of the genomic DNA from positive HCC samples; arrows indicate the mutation position within the sequence. Bottom right: prevalence of all mutations, designed for both DNA and amino acid changes

