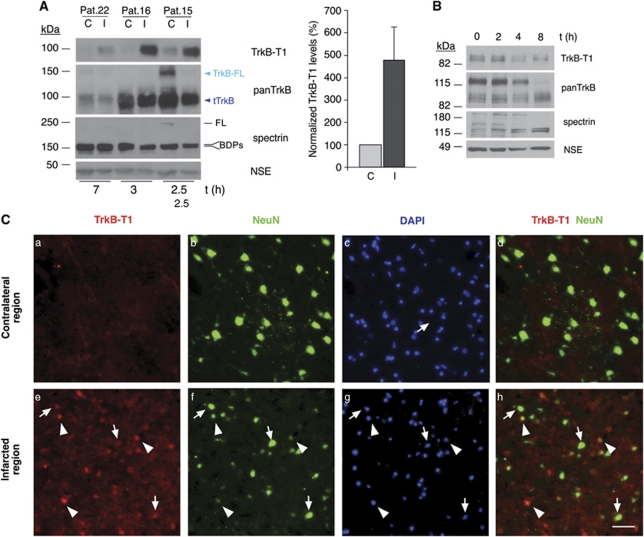
Figure 5.
TrkB-T1 isoform levels increase after stroke in human brain neurons. (A) Immunoblot analysis of TrkB-T1 expression in the cerebral cortex of three patients using an isoform-specific antibody. A comparison of the infarcted cortex (I) with the corresponding area of the contralateral hemisphere (C) demonstrated a dramatic increase of TrkB-T1 in the ischemic area, but similar levels of NSE in both regions. The postmortem time of tissue collection for each patient is indicated below the blot panels. Heterogeneous TrkB-FL levels in the control tissue of the various patients were observed using a panTrkB antibody that recognized the FL isoform and the truncated forms of the TrkB receptor (tTrkB). The processing of FL brain spectrin to produce breakdown products (BDPs) demonstrated the activation of this protease in necropsies corresponding to both control and ischemic tissue. The histogram represents the quantitation of the normalized TrkB-T1 levels (mean±S.E.M., n=3) in the infarcted tissue compared with the contralateral hemisphere, arbitrarily assigned a value of 100%. Student's unpaired t-test established that the observed differences were nonsignificant (P=0.1). (B) Demonstration of TrkB-FL cleavage in parallel to spontaneous calpain activation in normal brain tissue at different times after death. Individual Wistar rat embryos (E18) were kept at ambient temperature for 2 to 8 h before dissection of brain cortices, which were then compared with tissue collected immediately after death. No increase in TrkB-T1 levels was observed, showing that calpain activation and TrkB-T1 upregulation are not related processes. (C) Immunohistochemistry of tissue sections corresponding to infarcted cerebral cortex or equivalent regions in the contralateral hemisphere confirmed the increased expression of TrkB-T1 in the ischemic area, mostly in post-mitotic neurons labeled with a NeuN antibody. Heterogeneity of NeuN levels in the infarcted area is highlighted. Although neurons that have low TrkB-T1 levels are strongly stained by NeuN (arrows), high TrkB-T1 levels are associated with neurons that have low NeuN expression (arrowheads). The scale bar represents 50 μm

