
Figure 2.
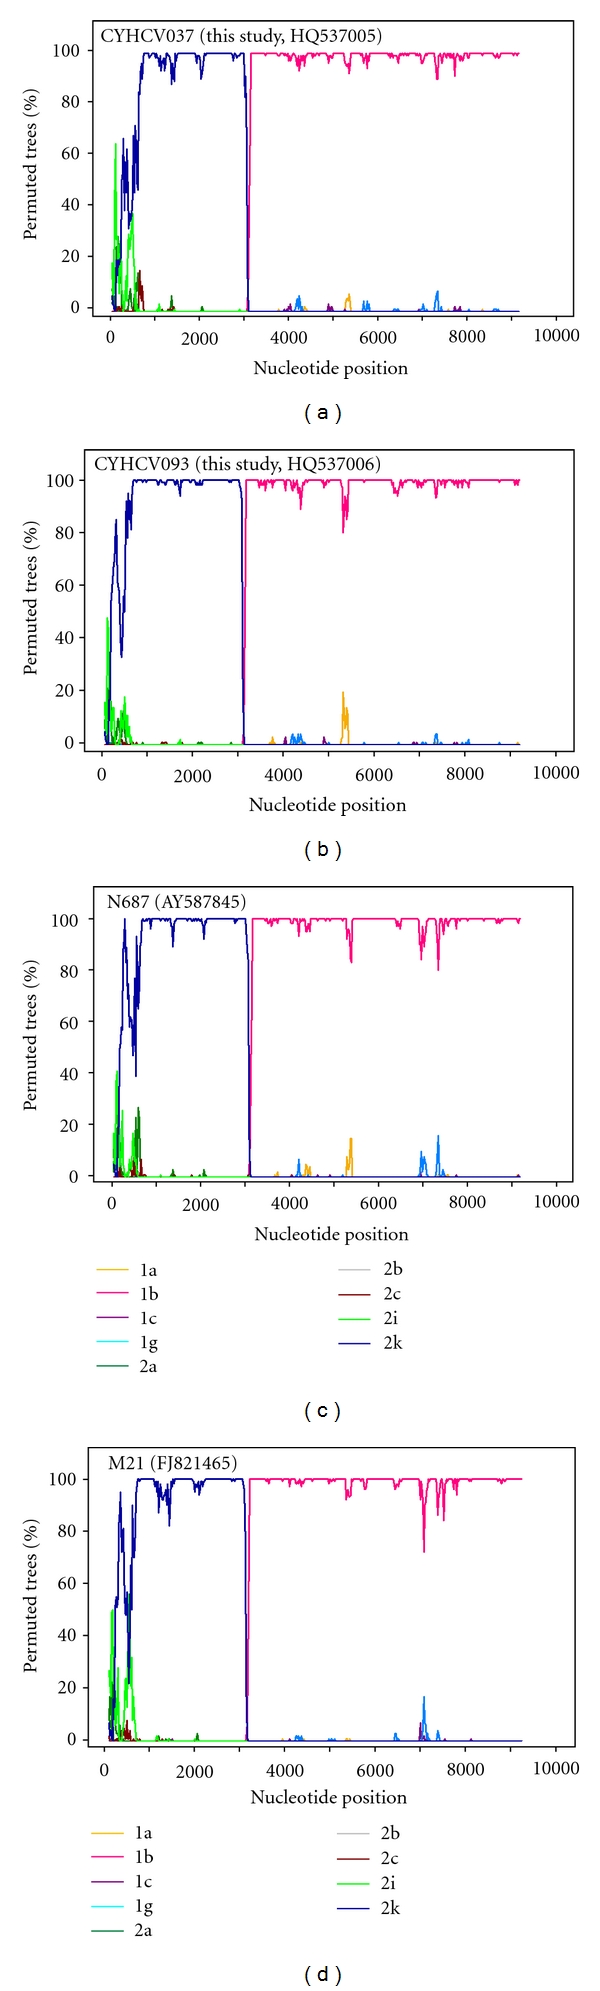
Bootscan plot of percentage permuted trees over nucleotide position across the full length of the 2k/1b recombinant strains. (a, b) are for the strains described in this study and (c, d) for the only near-full 2k/1b genomes submitted to GenBank to date. Strain identifiers are indicated at the top left corner of each plot. In brackets are the GenBank accession numbers of the sequences. The annotation below shows the HCV subtype of the consensus sequences corresponding to each line colour in the plots.