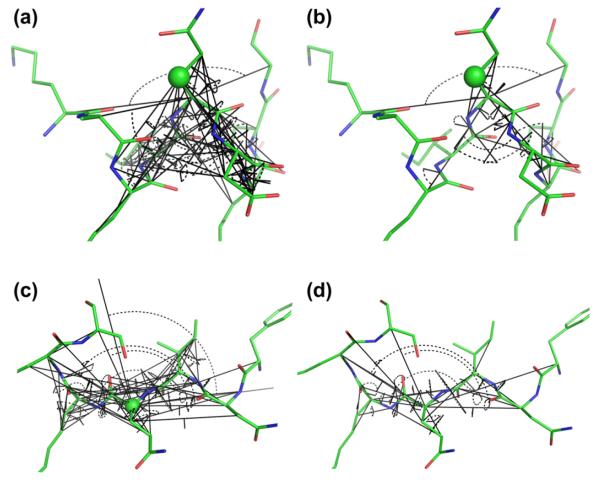
Fig. 12.
Visualization of the initial (a) and (c) set of torsion angles used by shAIC (72 in total) and the reduced final set (b) and (d) guided by the use of AIC. Torsion angles are shown with black arcs and the protein is illustrated as in Fig. 1 for chemical shift prediction for certain atoms (shown with green spheres): Cβ in helixes and Cα in coil states in charts (a) and (b) and (c) and (d), respectively. These two states represent those with the lowest (19) and highest (33) number of used torsion angles, respectively. (For interpretation of the references to color in this figure legend, the reader is referred to the web version of this article.)

