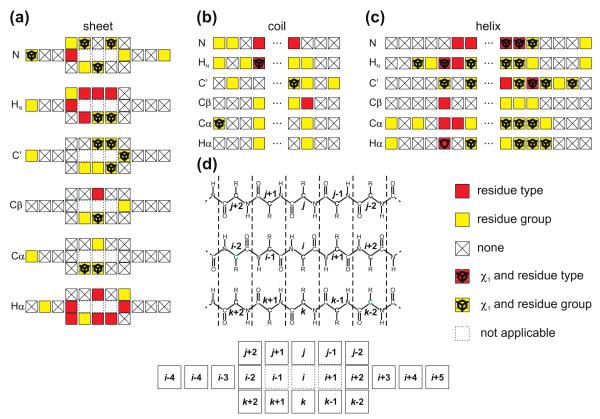
Fig. 13.
Pictograms visualizing the selected geometric parameters for the flanking residues. Selections of geometric parameters are shown for sheets, coils and helixes in (a), (b) and (c), respectively. It is indicated by a small pictogram whether, for a certain flanking residue, the residue type (red/yellow) and possibly the side chain angle conformation (black line-art) (see Eq. (9)) was chosen by shAIC or not (crossed box) and whether the residue type was considered as belonging to a predefined group only (yellow). The small pictogram corresponding to a certain flanking residue is placed according to its position in the primary sequence or hydrogen bonding register in the case of sheets as illustrated schematically in (d). (For interpretation of the references to color in this figure legend, the reader is referred to the web version of this article.)

