
Fig. 16.
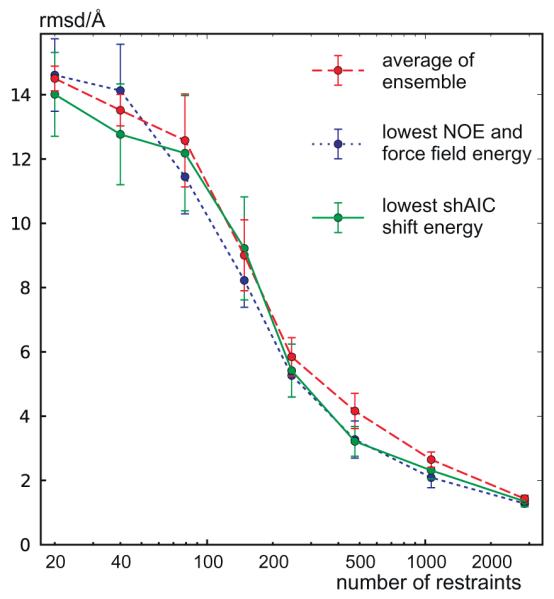
rmsd to reference structure as a function of the number of NOE restraints. An ensemble of structures was calculated for the protein with pdbID 1srr as described in Section 2.3.2 and the procedure was repeated to produce eight such ensembles each with eight structures, and again for all eight different groups using a different number of distance restraints. The rmsd to the reference structure is plotted for all eight members of the ensemble taking an average within the same ensemble (red curve), the member within each ensemble with lowest empirical target function combining NOE and force field energy (blue curve), and the member within each ensemble with lowest shAIC chemical shift pseudo energy (green curve). For each group with a different number of distance restraints, the standard deviation among the rmsds for the eight such best members (from the eight ensembles having the same number of distance restraints) are indicated by error bars. (For interpretation of the references to color in this figure legend, the reader is referred to the web version of this article.)