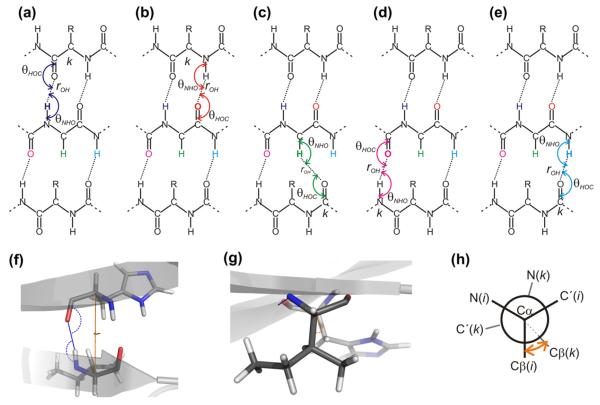
Fig. 4.
Main parameters used for describing hydrogen bonding. Panels (a)–(e): Schematic drawing of two hydrogen-bonded β-strands showing the two angles (with double-headed arrow-arcs), θHOC and θNHO, related to hydrogen bonding of (reference atoms) HN(i), C’(i), Hα(i), C’(i + 1), and HN(i + 1). Hydrogen bonds are shown with dotted lines in the same color as the reference atom, while continuation of the backbone is indicated by broken lines. For a fixed residue, i, as shown in the second row, the other residue (the hydrogen bonding partner) being hydrogen bonded to residue i is different depending on the nature of the reference atom. This atom specific hydrogen bonding partner is indicated by “k” in panels (a)–(d). (f) and (g) show a molecular representation of two residues part of a β-bridge viewed perpendicular to (f) and parallel to (g) the hydrogen bond illustrating the angles defined in panel a for hydrogen bonding of HN as blue arcs and the virtual dihedral angle θ25 (see Appendix A) defined by the four atoms Cβ(i), Cα(i), Cα(k) and Cβ(k) shown with orange arcs (where residue k corresponds to the hydrogen bonding partner. (h) pseudo-Newman projection showing schematically the definition of ω25 indicated by an orange arrow viewing down the axis going through the two atoms Cα(i), Cα(k). (For interpretation of the references to color in this figure legend, the reader is referred to the web version of this article.)

