
Fig. 6.
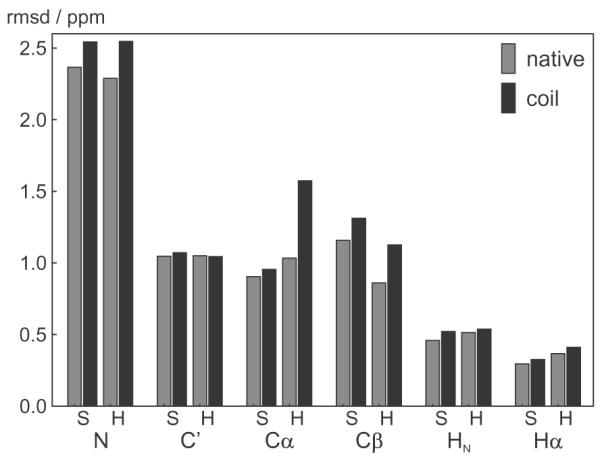
rmsds between observed and predicted chemical shift for native and mis-classified secondary structures. The bars show the rmsd in the evaluation set of 39 protein chains for the residues at the end of the helixes (H) and sheets (S) using the correctly assigned secondary structure (gray) and using a state mis-classified to a coil residue (black), hence using the native and the coil shAIC parameters, respectively, to calculate the predicted shift.