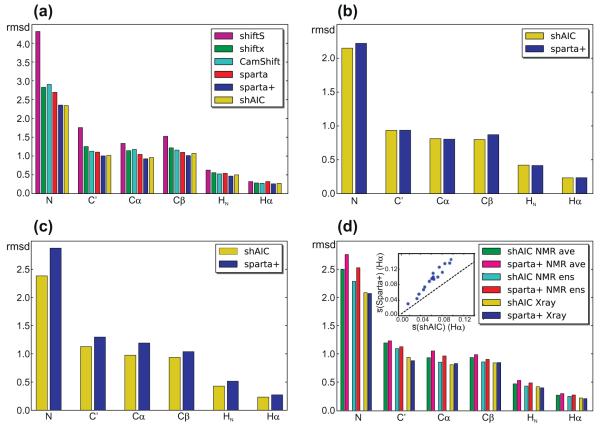
Fig. 7.
rmsds between observed and predicted tertiary chemical shift for different test sets (see Section 2) comparing the performance of shAIC and previous methods (see coding for bar filling in legends). (a) A control set of 38 protein chains having less than 25% sequence identity to any chain used to train shAIC, (b) a subset of 8 out the 38 chains having less than 25% sequence identity to the chains used for training Sparta+, (c) the set used for evaluating CS-ROSETTA after removing all chains already present in the shAIC training set, (d) a set of 19 chains consisting of the NMR ensembles for the entries in the 38 protein chain set in panel (a), for which NMR structures were available. The rmsd for the NMR ensemble was calculated by evaluating differences between observed chemical shift and the average of the predicted chemical shift for all members of the ensemble (designated by “ens” in the legend) and by evaluating the difference prior to evaluating the average (designated by “ave” in the legend). The insert in (d) shows the standard deviation within the ensemble averaged over all residues, s, for Hα shown as a blue dot for each protein in the set Sparta+ as a function of the corresponding value for shAIC with the identity line x = x as a dashed line shown for reference. (For interpretation of the references to color in this figure legend, the reader is referred to the web version of this article.)

