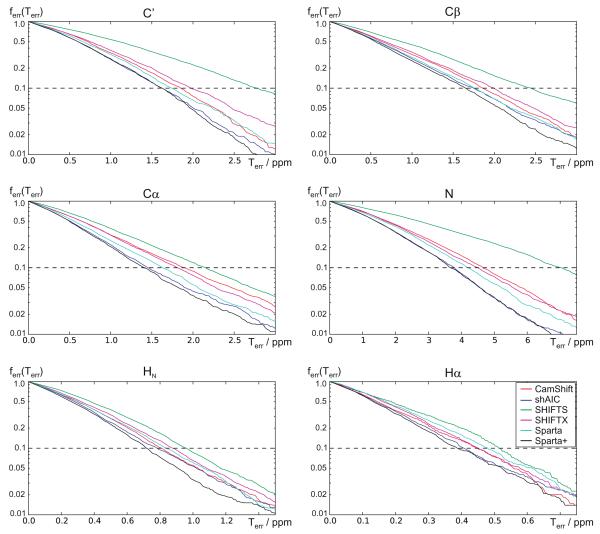
Fig. 8.
The fraction of assignment errors, ferr (Terr) as a function of the error threshold, Terr. Each point in the plots represents a threshold, Terr, and the corresponding fraction of predictions, ferr, having an error larger than this threshold. The plots were derived from the 38-chain validation set. shAIC (blue lines) are compared with other methods for all six atom types. Note the logarithmic y axis. (For interpretation of the references to color in this figure legend, the reader is referred to the web version of this article.)

