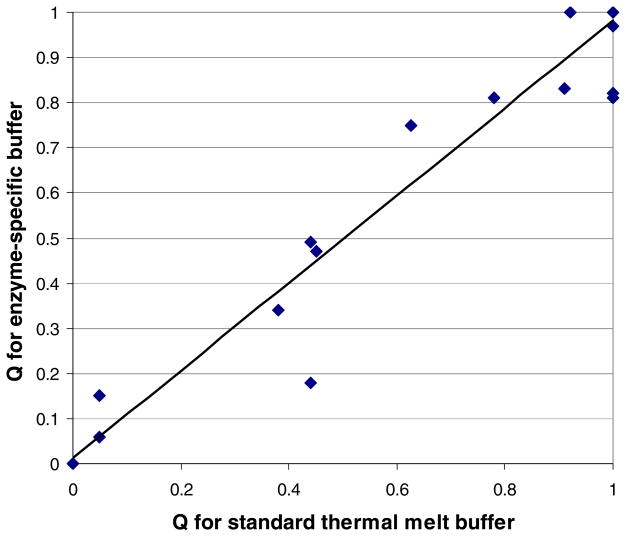
FIGURE 1.
Melting curve quality is similar in standard and enzyme-specific buffers. Q’s were calculated as described in Materials and Methods; each score is an average of at least five to eight replicate wells. Each data point represents a separate Plasmodium enzyme; many enzymes are represented by the point at (1,1). The best-fit line is: y = 0.97x + 0.01 (R2 = 0.94).

