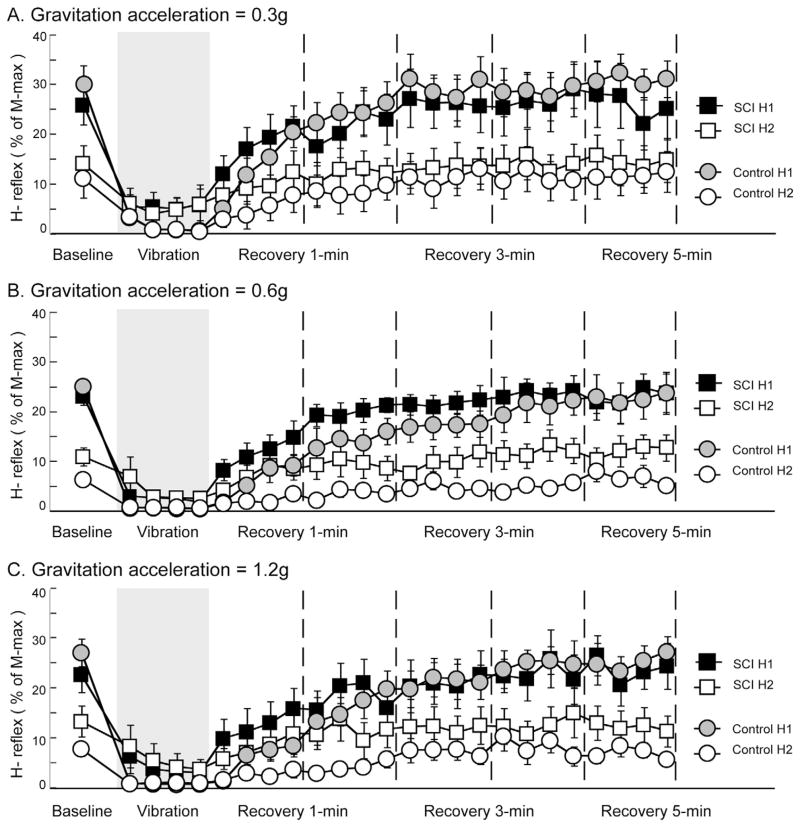
Fig. 4.
Average H-reflexes across different phases during different acceleration conditions. Each data point represents the peak-to-peak amplitude of H-reflex, expressed as the percent of the maximal amplitude of the M-wave across 0.3g (A), 0.6g (B), and 1.2g (C) acceleration conditions. During baseline phase, data points were averaged across all available trials within each subject and then averaged across subjects in each group. Data points during vibration and recovery phases were averaged over all subjects in each group on a trial-by-trial basis. Gray areas indicate the time when the vibration stimuli were applied on the lower leg segment. Dashed vertical lines delineate 1-min intervals after the cessation of vibration stimuli. Error bars, ±1 SEM.

