
Figure 8. Allergic provocation challenge with 450 μg CPE in peanut-sensitized mice following immunotherapy with CPE, recombined w/o 20 kD, or 20 kD fraction.
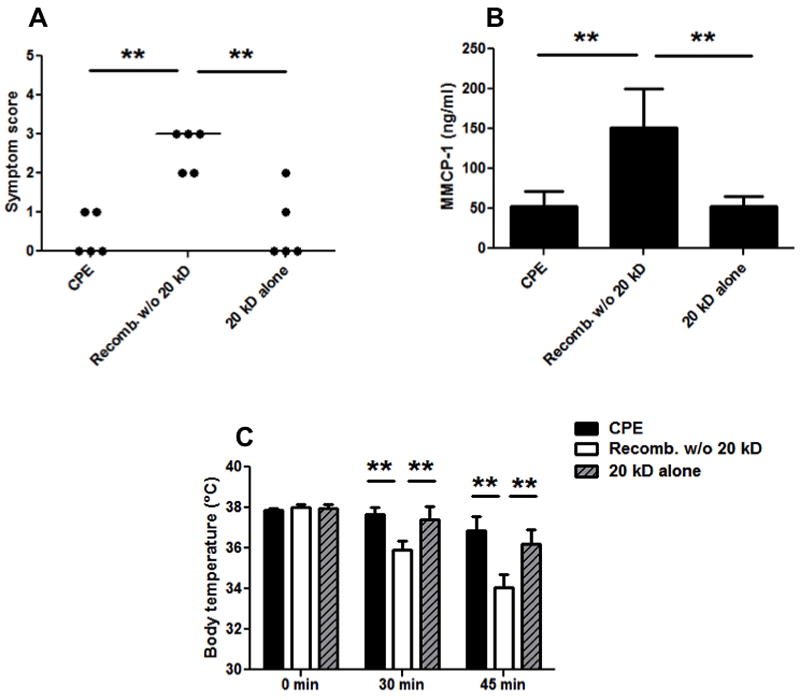
A: Symptom scores following CPE challenge in mice given immunotherapy. B: Body temperatures at baseline, 30, and 45 minutes post-challenge. C: MMCP-1 levels in sera samples post-challenge. These are the same mice challenged in Fig. 7 except the mice desensitized with placebo were excluded from challenge. Closed circles represent individual mice; bars show means with standard deviation; ** indicates p<0.01. A second independent experiment measuring symptoms and temperature changes with 3-5 mice in each group gave similar results.