
Figure 2. Effect of movement preparation and movement onset on the amplitude of MEPAPB and MEPFDI.
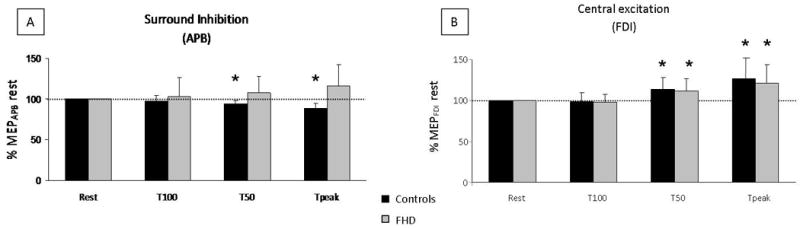
MEPs are expressed as percentage of rest MEPs in the four different conditions (rest, T100, T50, Tpeak), in controls (black) and patients (grey), during single-pulse TMS. A: A significant decrease of MEPAPB was observed in controls at T50 and Tpeak (surround inhibition) while patients exhibited no significant surround inhibition. * p< 0.05. B: Significant MEPFDI amplitude increase was found in both groups at T50 and Tpeak (central excitation).