
Figure 3. Premotor-motor interactions.
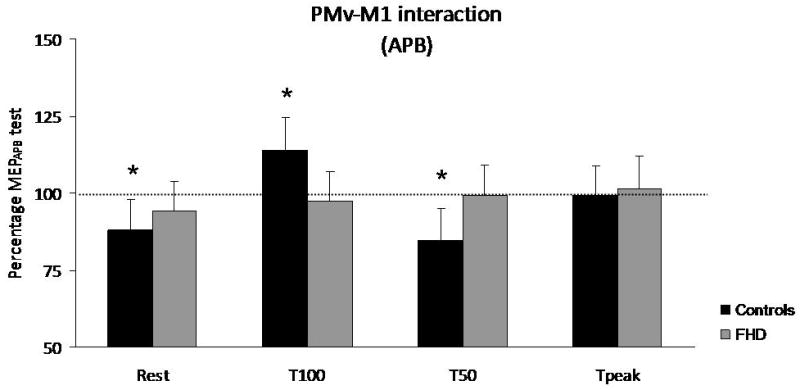
Premotor-motor interactions are expressed as percentage of MEPAPB test in controls (black) and patients (grey) during paired-pulse TMS. No influence of PMv over M1 was constantly found in patients. Controls showed a significant premotor-motor inhibition at rest and at T50, while a significant facilitation was observed at T100. * p<0.05.