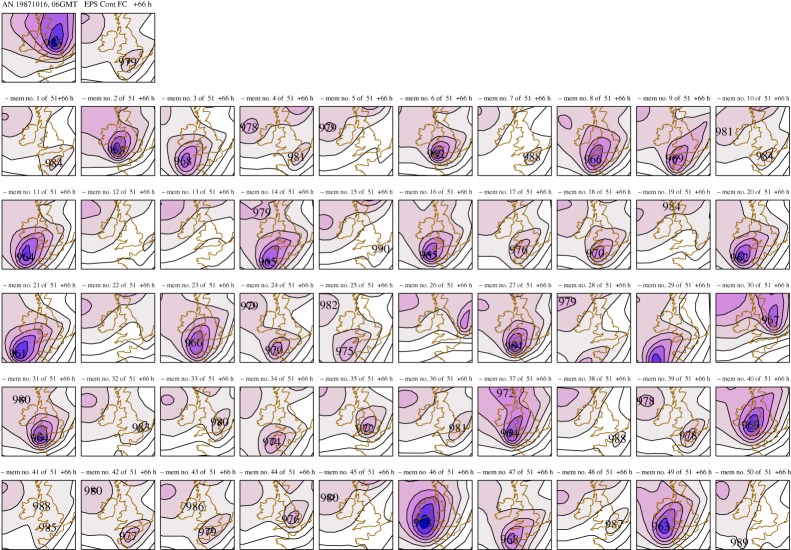
Figure 3.
Example of 66 h probabilistic forecast for 15–16 October 1987. Top left shows the analysed deep depression with damaging winds on its southern flank. Top right shows the deterministic forecast, and the remaining 50 panels show other possible outcomes based on perturbations to the initial conditions. A substantial fraction of the ensemble indicates the development of a deep depression.

