Figure 1.

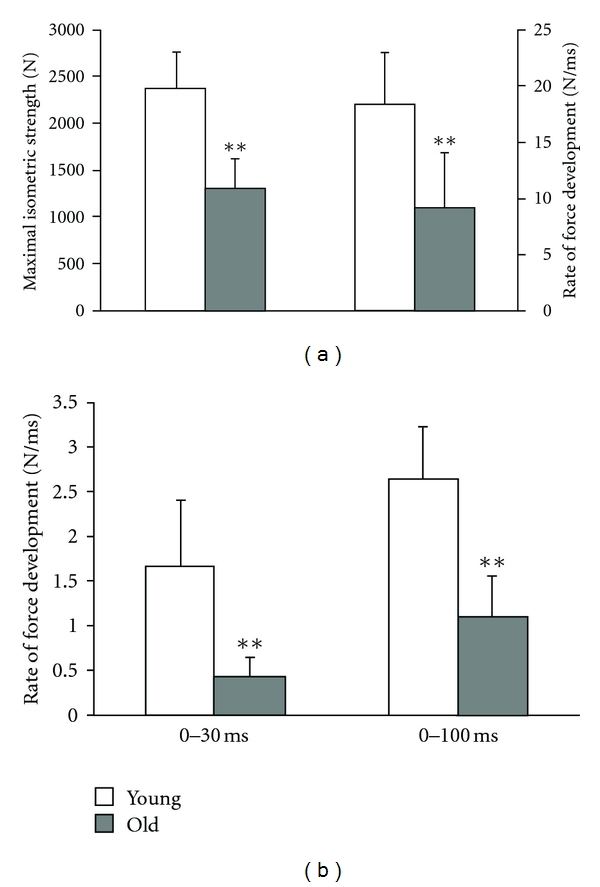
Age-related differences in strength. (a) Maximal isometric strength and rate of force development. (b) Rate of force development over time intervals of 0–30 ms and 0–100 ms. Young different from old: **P < 0.01. Adapted from Granacher et al. [15].
