Figure 1.

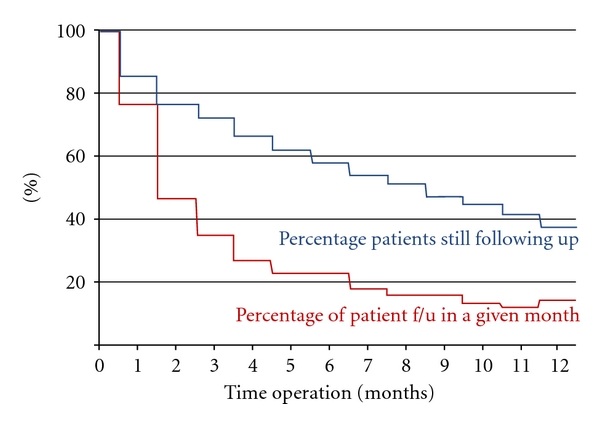
Follow-up diagram. This diagram outlines the percentage of patients that were still following up in our database (blue). The diagram also notes the percentage of patients following up in any given month after surgery (red). f/u: followup.

Follow-up diagram. This diagram outlines the percentage of patients that were still following up in our database (blue). The diagram also notes the percentage of patients following up in any given month after surgery (red). f/u: followup.