
Figure 2.
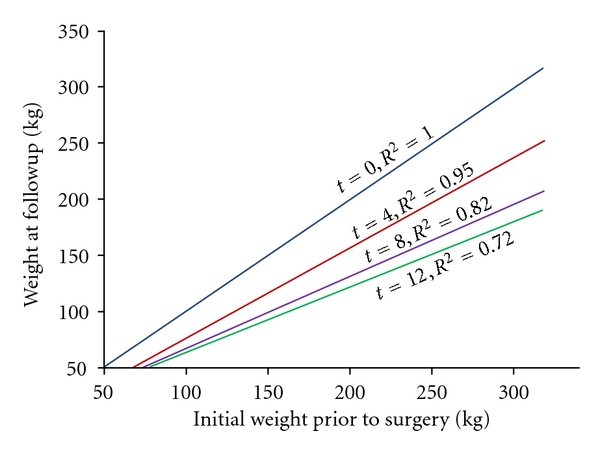
Linear regression of initial weight versus weight at followup. t refers to the month time interval after surgery. n refers to the number of patients in the linear regression model. t = 0, n = 1551; t = 4, n = 409; t = 8, n = 245; t = 12, n = 224.