Figure 3.

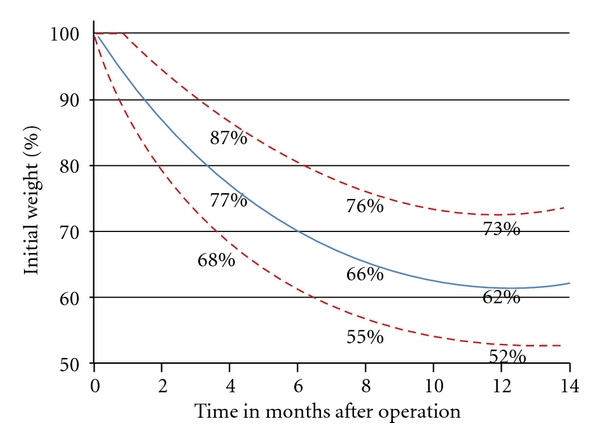
Regression model describing time after operation versus percent initial weight. n = 1551. All patient data points up to 500 days after operation were used to calculate the above curve.

Regression model describing time after operation versus percent initial weight. n = 1551. All patient data points up to 500 days after operation were used to calculate the above curve.