
Figure 3.
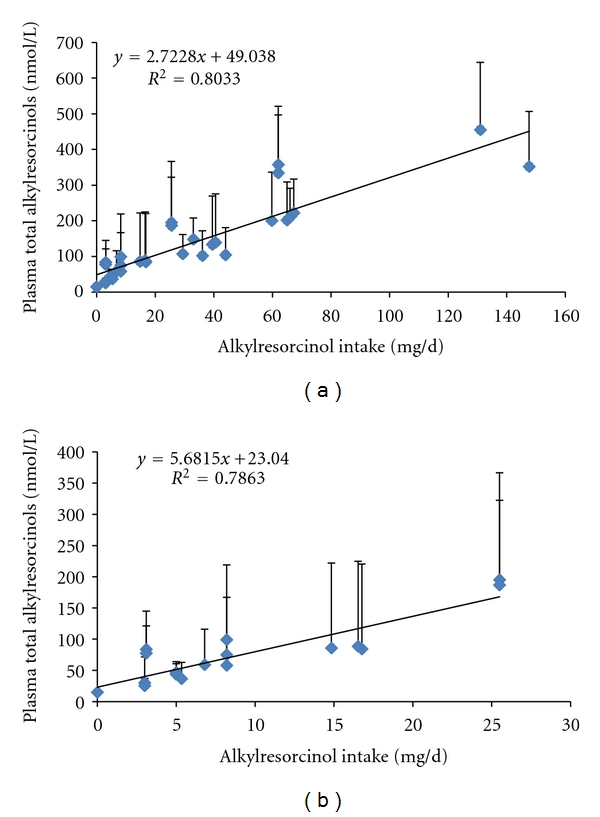
Relationship between mean AR intake and the mean of plasma AR across published studies (a). Where direct AR intake data was not provided, it was estimated from literature values if possible. Values are arithmetic means, and error bars are the standard deviation. Figure (b) uses data from studies where there has been an arm/group with an AR intake equivalent to 0–48 g of WG wheat (0–27 mg AR/d) to give an idea of the range at “normal” intakes, as well as the likely intercept for no WG intake.