
Figure 1.
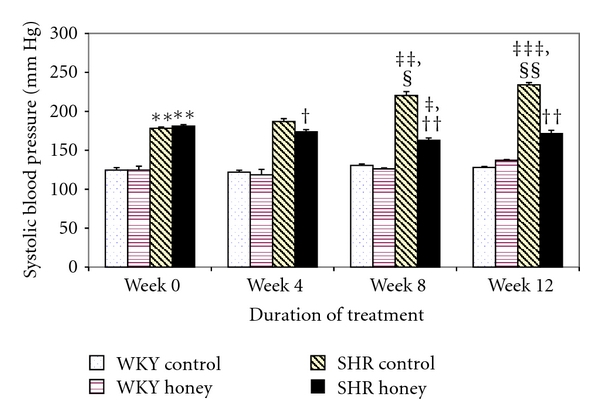
Effect of honey on systolic blood pressure in WKY and SHR during the treatment period. Each group consisted of six to seven rats. Data are expressed as mean ± SEM. **P < 0.01 versus WKY control at the same week; ‡ P < 0.05,‡‡ P < 0.01, and ‡‡‡ P < 0.001 versus the same group at week 0; § P < 0.05 and §§ P < 0.01 versus the same group at week 4; † P < 0.05 and †† P < 0.01 versus SHR control at the same week.