
Figure 10.
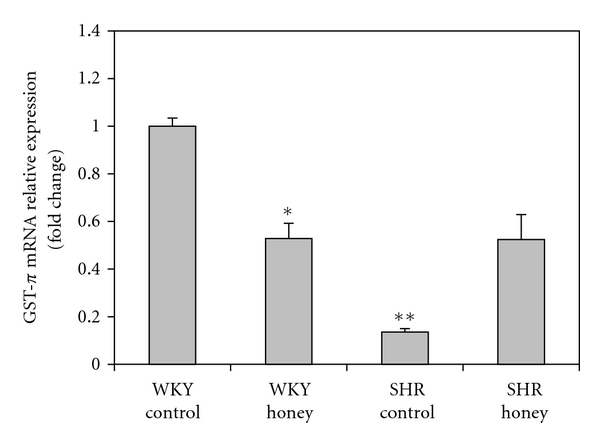
Effect of honey on mRNA expression of GST-Π in kidney of WKY and SHR. Each group consisted of four to five rats. Data are expressed as mean ± SEM. The quantitative fold change in mRNA expression was determined relative to the β-actin mRNA levels in each corresponding group and calculated using the 2−ΔΔCT method. *P < 0.05 and **P < 0.01 versus WKY control.