
Figure 4.
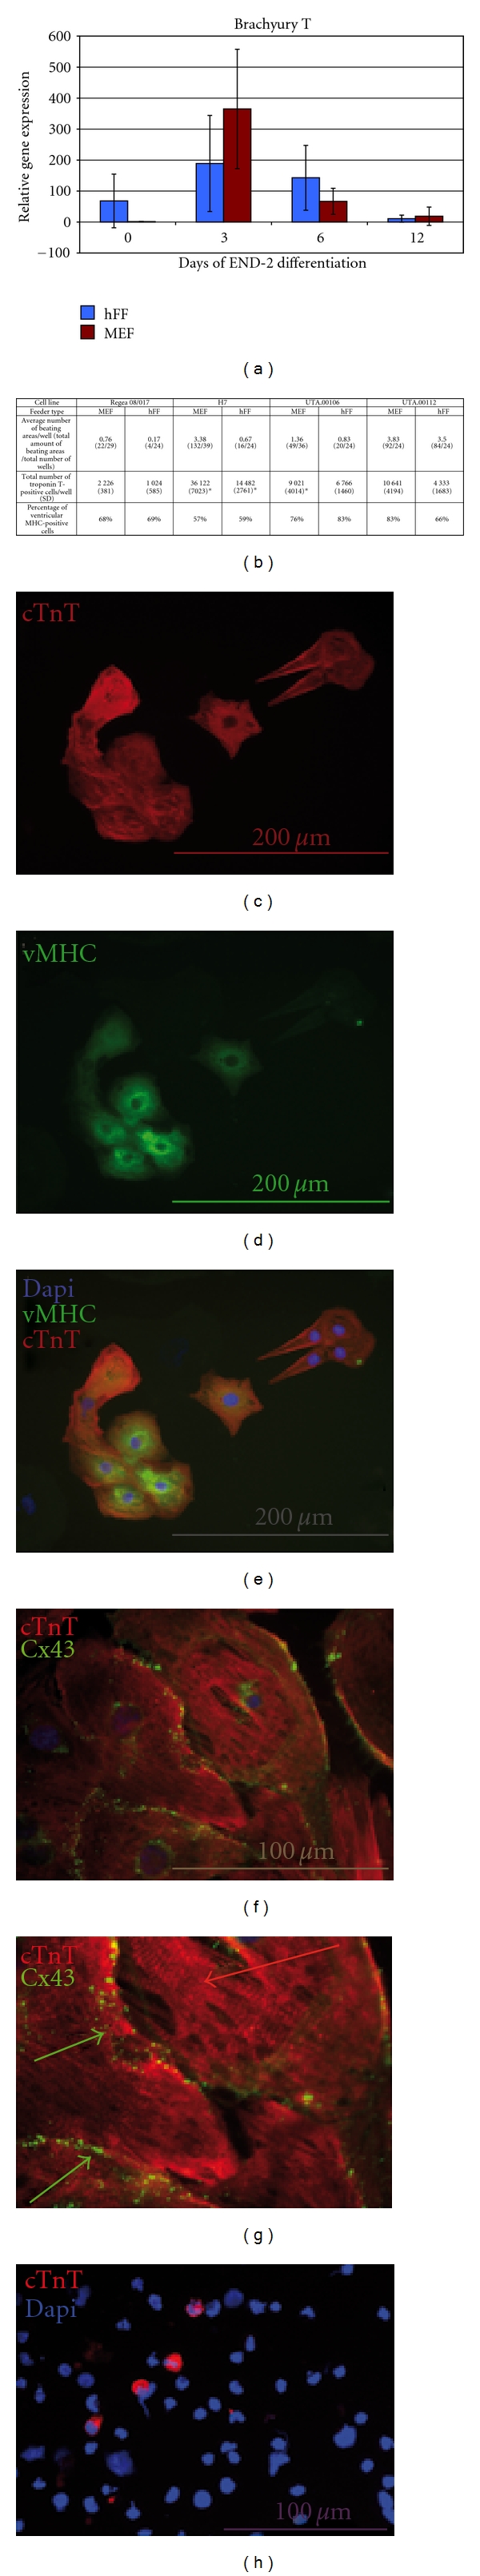
(a) Comparison of Brachyury T expression levels of MEF and hFF cultures. The differences of Brachyury T expression levels between hFF and MEF cultures on days 3 and 6 are statistically significant. In addition, the difference in expression levels of Brachyury T of MEF cultures between days 3 and 6 is statistically significant. Table in (b): Differentiation data of H7, Regea 08/017, UTA.00106, and UTA.00112 cell lines on MEF and hFF feeder cells. For H7, the difference between troponin T-positive cells is statistically significant, (P < 0.01). (c–h) Characterization of the differentiated cells. Troponin T (c), ventricular α-myosin heavy chain (d), and merged image with DAPI staining (e). Scale bar, 200 μm. (f) Merged image with Troponin T (red) and Connexin 43 (green) revealing gap junctions between the cells. Scale bar 100 μm. (g) Inset of image (f). (h) Cytospin slide of H7 (MEF) stained by troponin T (red) and DAPI (blue). Scale bar, 100 μm.