
Figure 9.
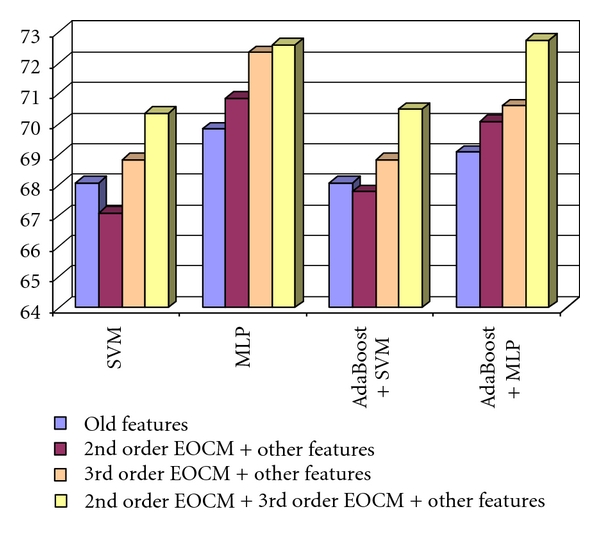
The comparison of the recognition rates obtained by combining the 2nd and 3rd order EOCM features with the old textural features in the case of the differentiation between HCC and the benign liver tumors.
Official websites use .gov
A
.gov website belongs to an official
government organization in the United States.
Secure .gov websites use HTTPS
A lock (
) or https:// means you've safely
connected to the .gov website. Share sensitive
information only on official, secure websites.
The comparison of the recognition rates obtained by combining the 2nd and 3rd order EOCM features with the old textural features in the case of the differentiation between HCC and the benign liver tumors.