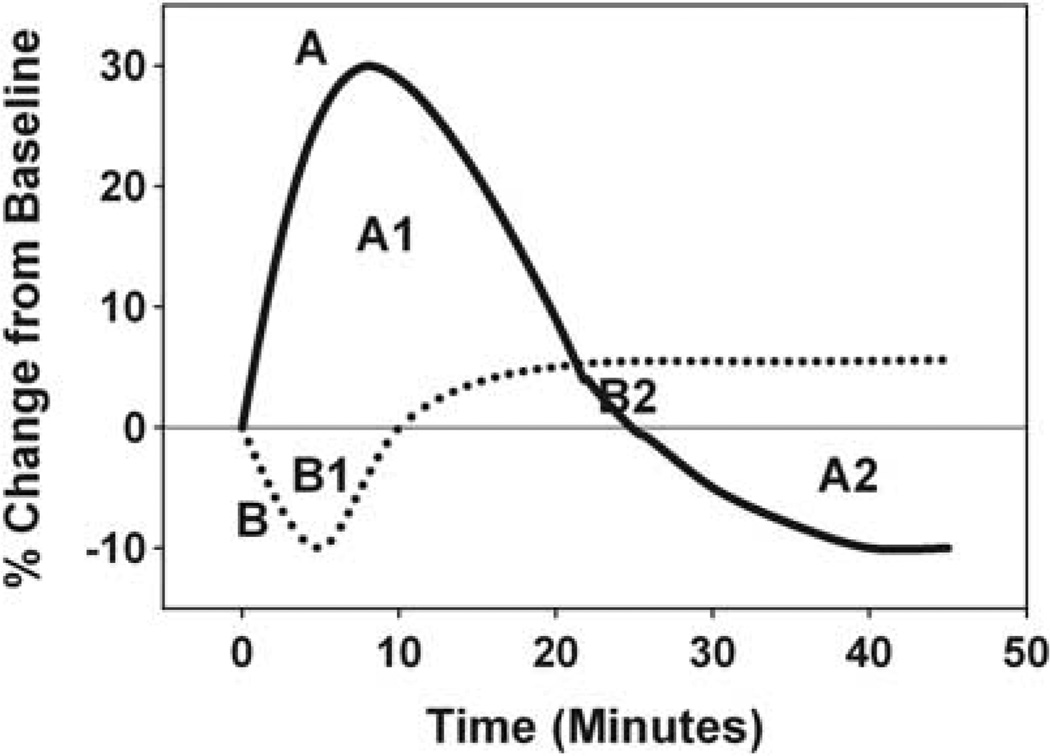
Figure 1.
Relative changes in mean cerebral blood-flow velocity (CBFv) for 45 min after suctioning for two hypothetical Infants (A (solid line) and B (dotted line)). A1 and A2 represent areas under the curve for Infant A, and B1 and B2 represent areas under the curve for Infant B. For example, Total area under the curve (AUC) (mean CBFv) for Infant A is the sum of the absolute values of A1 and A2.

