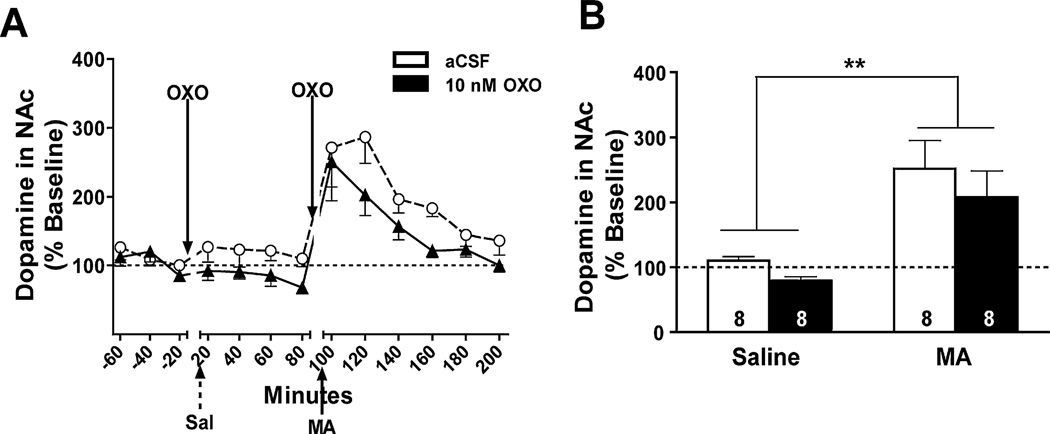
Fig. 5.
Effect of bilateral OXO microinjections into the LDT on DA levels in the NAc. Data are expressed as a percent of baseline (represented by the dotted line). (A) The time course of DA levels in response to intra-LDT OXO (10 nM; solid triangles) or aCSF (open circles) microinjection and IP injection of saline (Sal; broken arrow) or MA (3.5 mg/kg; solid arrow) is shown in 20-min bins. (B) DA samples were collapsed for each mouse after saline injection (Saline) and in the first 40 min after MA injection (3.5 mg/kg; MA) in each OXO treatment group for analysis. Microinjection of 10 nM OXO (solid bar) into the LDT had no effect on the MA-induced increase in DA levels. Treatment group sample sizes are shown on their respective bar. **p = 0.001 vs. IP saline.

