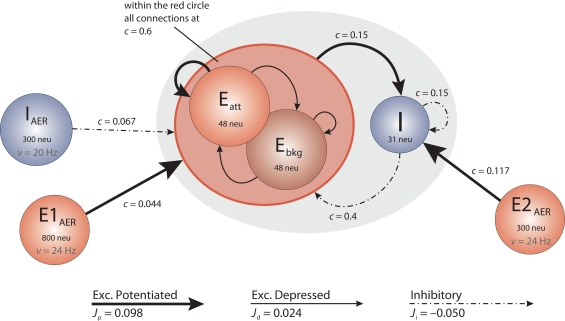
Figure 1.
Network architecture. Each circle represents a homogeneous population of neurons. The gray oval includes the on-chip populations: two excitatory populations Eatt and Ebkg (48 neurons each) and one inhibitory population I (31 neurons). Off-chip populations E1AER (800 neurons), E2AER (300 neurons), and IAER (300 neurons) are simulated in software. Connectivity is specified in terms of the fraction c of source neurons projecting to each target neuron. Projections are drawn to identify synaptic efficacies as excitatory potentiated (Jp), excitatory depressed (Jd), or inhibitory (Ji).

