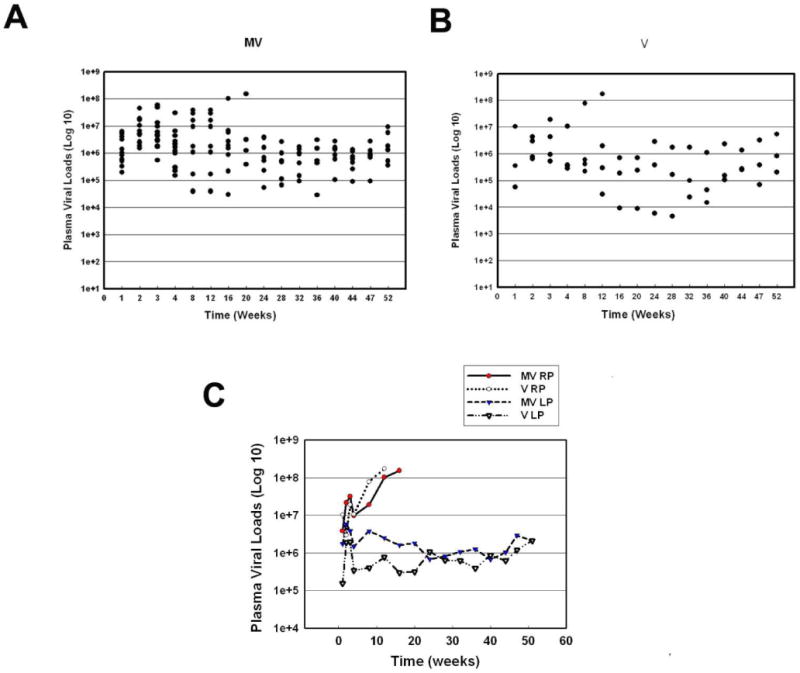
Figure 3. Viral load in plasma in SIV-infected monkeys treated with morphine compared to those without morphine.

(A) Scattergram expressing viral loads in plasma of M + V animals at various time points PI. (B) Scattergram expressing viral loads in plasma of V animals at various time points PI. (C) Average virus load in the plasma from MV RP, V RP, MV LP and V LP groups over time.
