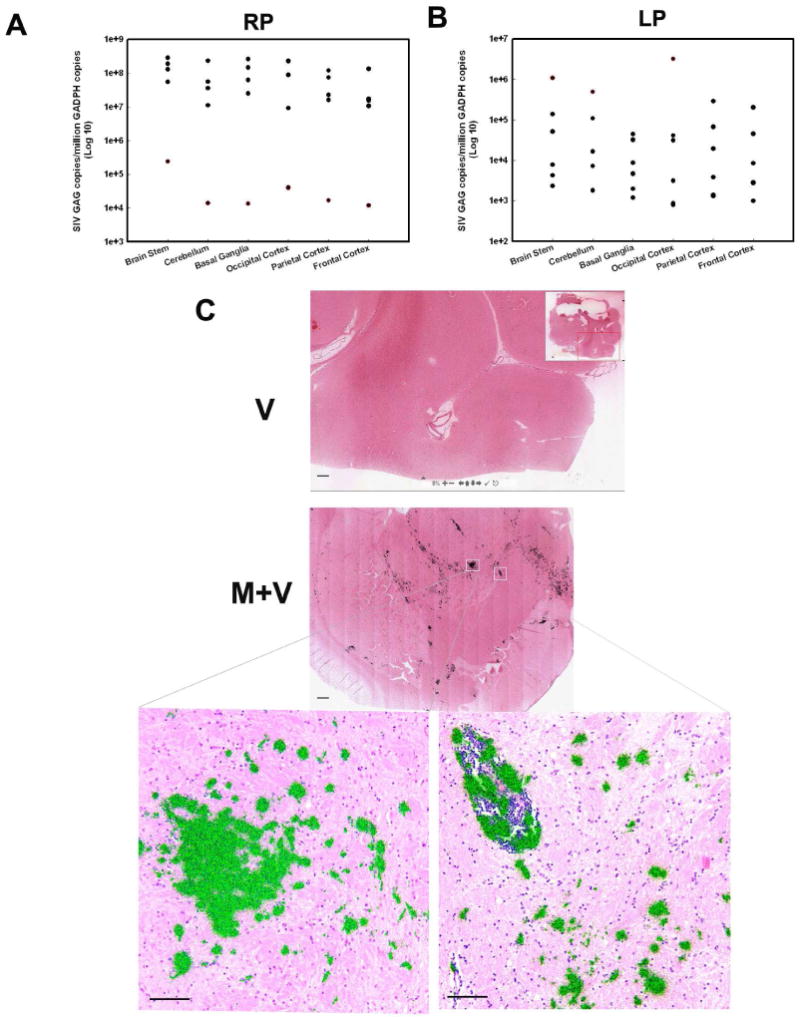
Figure 7. Virus RNA titer in different brain regions of SIV-infected macaque with or without morphine.

(A) Scattergram expressing viral loads in different brain region of RP animals at various time points PI. Black dots: A1, B4, B5, C3; Red dots: B6. (B) Scattergram expressing viral loads in different brain regions of LP animals at various time points PI. Black dots: A3, A4, C1, C2, C4; Red dots: A2. (C) SIV mRNA in the basal ganglia of macaque brain. In situ hybridization was used to identify SIV RNA in macaque brain sections from M+V and V group. The sections were hybridized to 35S-labelled SIV antisense probes. After washing, digestion with RNases, the sections were coated with nuclear track emulsion, exposed, and developed. When the radioautographs are illuminated with epipolarized and transmitted light, the light reflected from the silver grain imparts a greenish yellow color to cells that have relatively high levels of SIV-1 RNA. (Scale bar=500 μm for upper two panels; Scale bar=100 μm for lower two panels).
