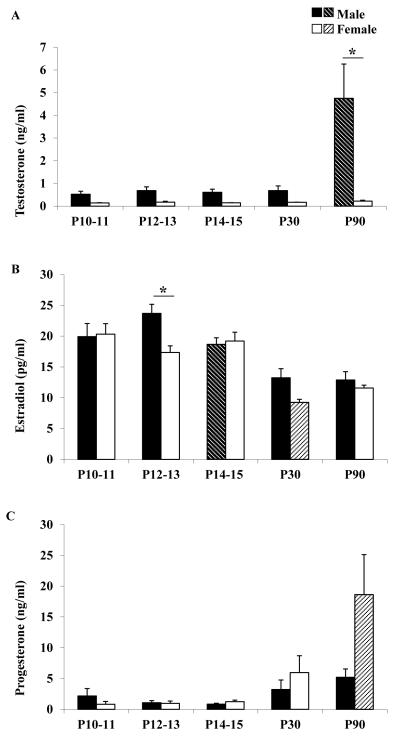
Figure 5. Sex hormone levels.
Testosterone (A), Estradiol (B) and Progesterone (C) levels in male (black and black shaded bars) and female (white and white shaded bars) rats postnatal ages 10-11, 12-13, 14-15, 30 and 90 days. Asterisk indicates statistically significant sex differences (P< 0.05). Shaded bars indicate a statistically significant difference (P<0.05) compared to the previous age group of the same sex.

