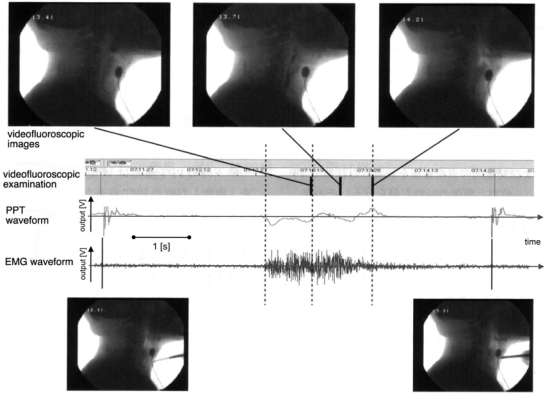
Figure 17.
SVF images, PPT waveform, and electro-myographic data of suprahyoid muscles acquired simultaneously [59]. The measurements were synchronized by tapping the PPT with a metal rod before and after swallowing, as shown in the lower section of the figure.

