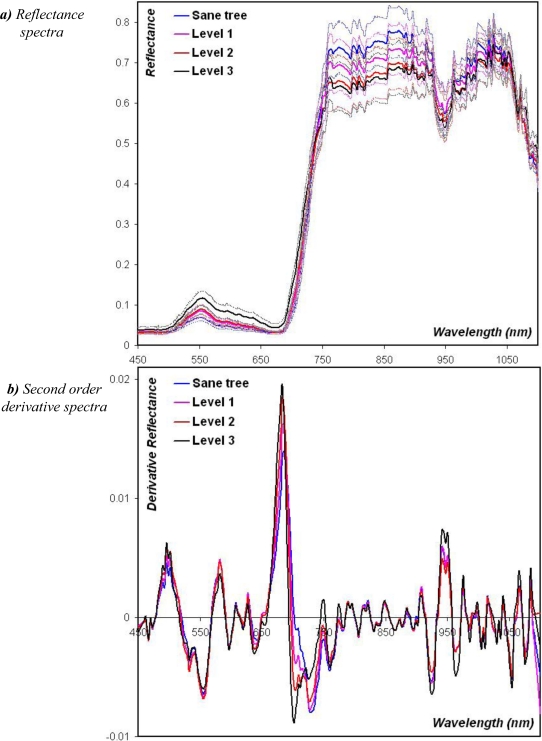
Figure 4.
(a) Mean hyperspectral reflectance for healthy oil palms (blue) and attacked by Ganoderma at the respective levels 1 (magenta), 2 (red), and 3 (black). Faint lines indicate the contours of the envelope based on standard deviation. (b) Mean derivative filtered spectra at the 2nd order of derivation for each class.

